Tuesday, 6 August 2013

It's been about a year since I last looked at T2 production, specifically the Cap Recharger II module. I also made some predictions so let's see how right (or wrong) I was too.

Firstly, some basic data (you can click on it to expand it if you like):
Still profitable over the 4 years, and reasonably consistent. Costs have gone down in the last year but the market price for the finished product has followed that decline.

Looking in more detail at the costs (and also my predictions for how they would evolve), again firstly here's the data:
  • Minerals went down as I predicted. Large market manipulation seems to be largely over for the time being (or more subtle at least) and minerals have returned to some sort of equilibrium price.
  • PI went up marginally rather than down. Looks like PI reached its floor fairly quickly, faster than I thought. It has almost no impact overall but since it's the only prediction I got wrong, that's a bit annoying.
  • Construction components are down. My prediction that they would continue to rise was correct in the months following June 2012, and rises continued until CCP took action on OTEC (the cause of the rises). Effectively CCP played the part of regulator. The materials to produce these components were only found in moons in certain parts of the galaxy, an area controlled mostly by one corp, creating a monopoly. As economic models predict, in a monopoly situation the price rose, until the regulator intervened, and now we have a big drop in those prices (28% drop), but not as low as the drop in...
  • Datacores which fell through the floor, dropping a whopping 46%. My prediction that they would end up below the previous low of 2011 was correct but if anything too cautious.
I'm starting to get enough data to see how well this fits economic models, but unfortunately I haven't been collecting any volume data (which would give some indications of supply or demand). Of course even if I had that, it's an item which is not only sold by the manufacturer direct to the consumer, but it's also traded quite heavily. In other words, it'll probably never fit neatly into one of those nice neat looking economic models you read about in textbooks but which never actually work in real world situations :)

Wednesday, 13 June 2012

Wo sind die Industriellen? ¿Dónde están los fabricantes?

Something a little different today. It's been about 3 years that I've had this blog, I thought I'd take a little look at the readership. Where are the industrialists in Eve physically located in the real world?

Top 10:
  1. USA: 39%
  2. UK: 18%
  3. Canada: 6%
  4. Germany: 4%
  5. Australia: 4%
  6. Austria: 3%
  7. Sweden: 3%
  8. Netherlands: 2%
  9. Spain: 2%
  10. Finland: 1%
  11. Others: 17%

Out of the others, it's Europe (mainly Eastern Europe actually, hello Latvia in 11th place!!) and the only non-European / non-North American country to appear at all is Singapore. Nothing else in Asia, nowhere in Latin America. I know there's a language barrier, but that still surprised me a little. Also a surprise, no France in the top 10? France was waaaay down in 17th place. Unfortunately I also don't know how this stacks up relative to Eve's overall user base, but anyway I thought it was interesting (even if it is a bit of navel-gazing on my part!).

Sunday, 10 June 2012

T2 production changes and predictions

Well I'm back playing Eve again. I think over the last year there have been a lot of changes and a decen shift in attitude from CCP regarding listening to players. That plus a decent reactivation offer means I'm giving it a go again.

Been reading up on the forums and it seems like there has been a lot of activity, inflation on minerals and ships especially, Hulkageddon and the Goons are much of the chatter recently. I'll write more on that later, for now a simple post on how all the changes have affected the module I've used as an example previously: the Cap II Recharger.

So, still definitely profitable but not as great as it was in 2011, back to 2010 levels. More costly to build but the price has increased. Costs have gone up quite dramatically, I've analysed that below as well.
A big change in minerals and construction components. Both, it would seem, down to the Goons, or at least in part. Hulkageddon and Burn Jita seem to have provided a either a smokescreen for, or were part of, the mineral market manipulation recently which seems to have been driven by the Goons and followed by many speculators. However, there have also been some quite significant changes to loot drops so CCP's actions have also been a key driver.

OTEC (which includes the Goons and other corps) have driven up the costs of construction components drastically. However, Technetium is so scarce anyway that I wonder how much affect OTEC's market manipulation really had - the trend in price increase seems steady and goes further back than (I believe) OTEC has been attempting to manipulate the market. I could be wrong there, I'm not an insider to OTEC, but it seems to me that the scarcity is the prime reason for the increase and manipulation has only a minor effect.

So looking forwards and making some predictions:
  • Will mineral costs change further? Has the market manipulation ended, if not when will it settle? I also see forthcoming changes to the game with ring mining and that will undoubtedly have an impact later in the year. I think by the end of the year, prices will have dropped somewhat but will still not have stabilised.
  • PI will continue to fall; I predict that basically the floor's the limit on that since the skills required are low, leading to oversupply. If it weren't for the increased taxation on PI I think prices would be down even further.
  • Construction components will continue to rise. There's decent margins in T2 still, basically the market can accommodate a price rise and this is the most scarce building material.
  • Datacores I expect to drop in price with the changes to faction warfare LP stores, and looking at the prices recently that market does seem to have turned the corner and prices starting to decline already. However, this decline may be short term and down to users cashing in research points with agents before the nerf, thus flooding the market. I personally am predicting a slight decline though, ending up below Feb 2011 levels.
Strawberry out.

Tuesday, 19 July 2011

Captain's Quarters make me sad

Incarna has made me completely lose interest. NEX exchange is not interesting, I don't mind one way or the other about microtransactions, but it's not a player-driven market (which is why I play Eve) so it's simply just not of interest. But it's the Captain's Quarters which is truly appalling. It's not often an expansion to a game makes it worse, but CCP has managed it.

As an industrialist, I spend most of my life in stations. My choice is now wait 20-30 seconds for a terrible 3D environment to load every time - a 3D environment which actually lacks the functionality to be usable (for example there is no way to look at your items in a station), or alternatively I can stare at a picture of a door which doesn't open. I don't want to do either, so I'm not. Maybe I'll come back to Eve in the future, right now, no.

Dumb.

Dumberer.

Tuesday, 8 March 2011

Being profitable isn't enough...

Now that I'm back producing T2 items, I updated my own spreadsheets to check profitability and got cracking on manufacturing the most attractive looking items. More recently I've obviously been trying to sell them, and since I've managed to almost double my output, it strikes me that there's more to building than just choosing the most profitable items. Once you can produce a decent volume, you have to really worry about how fast you can sell.

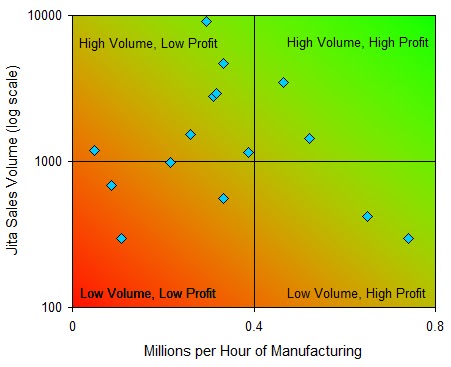
So I played about with my spreadsheet a bit and came out with this:
To explain as simply as possible:
  • The Y axis (side) is just the daily sales volume in Jita. (I changed it into a logarithmic scale only because it's easier to view the output). Further up the graph = higher number of units sold per day.
  • The X axis (bottom) is the millions of isk per hour profit I make. This is calculated by dividing the profit of the item by the time it takes to build. Further to the right = more profitable.
  • Each little blue diamond is one item I can make. They are not labelled here because I'm not giving away all my secrets! The point of this post is to show you how to build useful tools, not give out freebie advice.
So in the end we have 4 quadrants, high volume/high profit quadrant (top right) containing the best items to make.

The most profitable items don't sell many units per day, so I've got a bit of an overstock of them that will probably take me a while to shift. They end up in the bottom right quadrant - low volume but high profit. I do want to keep manufacturing them, but if I devoted all my slots to that I'd make more than 10 times what I could sell and end up with a lot of T2 stuff hanging around my hangar floor.

Building a spreadsheet like this is extremely helpful when deciding what to manufacture - it wasn't until building this that I can really focus my efforts. If you know how profitable your items are (and you should!) then all you need to do extra is find a source for the volumes. I used Eve Tools. It's really not hard to do.

I hope this sort of analysis helps other budding Eve entrepreneurs!

Tuesday, 1 March 2011

February in review

The wallet journal downloads seem to have gone a bit wrong (thanks CCP!), which is going to make my corporation reporting a pain. Here's a few basic things this month (it'll probably take me a while before I can do the full reporting I did previously):
  • My POS got blown up when I was away, my own fault really, I forgot to refuel. Had to relocate as there were no moons left in my old home, and also buy a new POS. Bummer.
  • Despite this I still managed to increase the corp wallet by around 200m isk.
  • Partly this was down to dumping my stockpile of PI products, bought back when they were not PI products, for a sizable profit. A one-off divestment to counter my (hopefully) one-off investment in a new POS.
  • Other than that I've been doing some PI (and blogging about that this month) and that averaged 1.6m isk per planet per day, 20% below my target although that includes a 7 day cycle.
  • Invention is working nicely with the use of base items to boost my chances. I ended up with 62% success rate (112 successes out of 181 attempts to be exact).
  • And of course I've also been selling T2 as well, which is generally up in profitability as discussed in the last post.
In summary: a lot of fiddly tasks done (anchoring a POS, much hauling, setting up planets) but things are set up well for March when I should also be able to bring more manufacturing online and work through the backlog of T2 blueprints that the use of base items in invention has allowed me to generate.

Sunday, 27 February 2011

Tech II invention profitabilty up despite technetium

Having taken a break from Eve for a while, but now back again, I thought I'd better take a look at how profitable my items are today. When I compared this to how it was 8 months ago, the results make for some quite interesting analysis. I'm going to use the example of Cap Recharger II modules, one of the most traded tech II items.

Despite technetium prices going through the roof, increasing the prices of construction components (Nanoelectrical Microprocessors and Tesseract Capacitor Units), the launch of PI increasing prices of Superconductors, and the mineral basket increasing, overall costs have gone up by only 3.7%. There has been a huge decline in the costs of datacores and this has almost entirely offset the increases of all the other materials required. Note: I have included everything except taxes (constant) and the cost of lab jobs ("zero" for me since I use a corp POS but then of course I have fuel bills to pay, not included here, and they have increased drastically).

Not only have costs gone up, but so has the price of the finished product as well. Right now Cap Recharger II's are at a high price, which may not last, but here's the breakdown of the costs versus the sales price anyway:
Up to 62% profit, very nice indeed. The sale price has increased at about 8 times the rate of the price of the cost of materials.

Prices have been quite turbulent over the last 6 months though, as shown on the graph below (thanks to Eve-Tools for the data). Even at the low of 450,000 isk per module, there's still 33% profit margins to be made.
Unfortunately I can't find a good reason for the changes in price. The price decline in November followed a spike in volumes (number of units traded), but otherwise price seems only weakly related to volume.

Regardless, I'm happy. Although I've just analysed Cap Recharger II's here, this seems to be a general trend with the tech II modules I produce (about a dozen different modules) - costs up by a small or moderate amount, but market prices of (most) end products up enough to compensate.

Monday, 21 February 2011

The long and the short of it

After trying longer extraction times, the average across all my planets is that 7 day extraction times produce the equivalent of 2.7 days worth of materials if I was running 24h extraction times. So just over a third the amount of materials. That puts every planet at under 1m isk per day. Across the two characters that's still be over 250m isk a month at almost zero effort.

I did that through necessity (away for a week without Eve access) but it was also a useful exercise. It's clear which planets had seemed good but in fact I was extracting from "nuggets" which have now disappeared, and which planets are genuinely good planets. Nuggets are temporary pockets of resources which don't renew but once they're extracted, they're gone. It definitely takes a few days to see what's what on planets - patience is a virtue when it comes to PI (and Eve generally, really).

There are 4 or 5 planets of my 12 that I'm going to change based on their output so far. That means losing out on having my own supply on a couple of POS fuels, but that's business - my aim to to maximize revenues, not look after my own supply. It's not like I'm in a wormhole - my POS is in high sec where there's no risk attached to hauling POS fuels, and no shortage of sellers either.

Friday, 11 February 2011

PI setups

So far my PI has been largely around producing P2. Typical inital setup is:
  • 2 x ECU
  • 4 x Basic Industry Processor
  • 2x Advanced Industry Processor
  • 1 x Launchpad
Everything gets routed to/from the launchpad. There's a screenshot below.
The eagle-eyed amongst you will notce there are actually 5 basic processors there. This planet is producing a bit more material than the 4 basic processors would consume, but not a lot more. So my optimised setup is to swap the 5th processor between the two P1 products each day. Note that I don't need to rebuild it, only change the schematic, which is free to do. At some point I will have to build another advanced processor to use up those extra P1, or ship them to another planet to have the P2 manufactured there.

My "best" planet actually has 6 basic and 3 advanced processors, but for most of my planets it's 4 and 2.

I'm also trying out a bit of P1 but that's a pain because of the hauling required. It seems to need emptied every day and a half. Setup is below:
You can see there is only 1 ECU. The 8 basic processors keep pace almost exactly with the 10 extractor heads. Not quite sure how best to optimise this. I have tried adding an extra ECU but then I can only fit on a couple of heads and no processors to actually convert the extra material to P1.

More to come as I optimise the planets more!

Tuesday, 8 February 2011

PI : week 1

As mentioned I've been experimenting with PI. I've been in high sec space only with two characters (both 5/5 in Interplanetary Consolidation and Command Center Upgrades). PI was only being done for 6 of the 7 days though, since I ended up spending a day moving my operations for reasons I won't bore you with.

So far, I calculated I've produced 80.7m isk worth of materials from PI in the first week. I know I can improve on that.
  • That's an average of 1.1m isk per planet per day
  • That's low. It took me some time to get exactly the right setup on a planet and get a good balance of materials coming into factories. Now that they are optimized, my planets vary from 1.2m/day to 2.8m/day.
  • The worst planet I set up was producing Robotics. I calculated that planet made nearly a loss of 1.5m isk per day compared to selling the Mechanical Parts and Consumer Electronics that I was feeding it. Without that planet I would have an average of 1.3m per planet per day.
So that's the results, what have I learnt (and what can you learn) and what's the next steps in the experiment?
  • P1 products seem to be the best so far, better than P0 or P2 (although I have not experimented with P3 or P4). "Optimized" planets producing P1 vary from 1.5m/day to 2.8m/day
  • Variation in the "isk per day" amount comes not only from what is being produced but also the individual planets can vary quite a lot in terms. For example, I have 2 planets producing the same P1 but one makes about 300 units/day and one makes only around 220/day.
  • So the next challenge is to replace the low value planets by a combination of moving planets and/or changing what is produced.
  • This means a bit of market research on the items (always a good thing to do before you start, I would have avoided the costly Robotics mistake). This looks like a very interesting tool produced by player Wyke Mossari.
  • However, there seems to be no easy way to determine "better" planets. The planets I mentioned (one producing 300 and one only producing 220) seem almost identical in terms of concentration of minerals. Competition may be a factor, I may just be in a bad spot, planet size may play a role... naturally I'll blog about it once I do a bit more research on this.
If each planet was making 2m isk/day, that would be enough on its own to pay for PLEX for both characters and play the game without real life cash. I'm going to make this the objective of my experiment.

Wednesday, 2 February 2011

Back at the coalface

After taking a bit of a break from posting and Eve, I'm back doing both. Since there's some new Planetary Interaction (PI) stuff, I thought I'd give that a try for my first month back. I've got 2 characters that can do PI and they're both based in high security space. Naturally I'll post the results here and also any tips I discover and so on. I'm starting with producing POS fuels and also some products required in tech II production.

I have to say the new PI interface is a big improvement, a lot less clicking and more flexibility. However, it does seem that you need the greater flexibility, the resources which never seemed to really diminish to any great degree in the "old" PI now seem to get mined out quite quickly so there is a need to move extractors around more in the new system. Overall though, a (tiny) bit more thought required and a lot less wrestling with the UI are both good things in my opinion.

Lastly, nothing to do with PI but the new character generator produces great results. As always on this blog, my main and my industrial alt will not be displayed but below is my forum character (also the character associated with this blog), the delightful and somewhat cynical Princess Strawberry.

Saturday, 17 July 2010

Costs and benefits of items in invention

The recent poor run of inventions made me think about how to improve this aspect so that I get a more reliable "flow" of tech II BPCs to build from. I haven't so far been using any "base items" in my invention so I thought I would work out the effect they would have. Base items are simply the meta 1/2/3/4 version of the item you are trying to invent, and they get consumed in the invention job.

The table below shows the chances of success with and without items. I've also calculated the averge cost of one success based on a theoretical 1 million isk cost of the datacores required. This means I can also calculate the actual benefit (in terms of isk) of the item.


Chance Average cost per success Average benefit of item
No item 50.4% 1,984,127
Meta 1 52.5% 1,904,762 79,365
Meta 2 56.0% 1,785,714 198,413
Meta 3 63.0% 1,587,302 396,825
Meta 4 84.0% 1,190,476 793,651

The average cost of datacores for me is not exactly 1 million but varies per job and varies over time depending what the datacores cost, so here are the equations to use to calculate your own table:
  • The chance of success I have taken from this very useful website and the chances shown in the table above are for max skills (5/5/5 in the appropriate 2 science skills and the racial encryption skill)
  • Average cost of success = (1/chance) x cost of datacores
  • Average benefit of item is just a simple subtraction of the meta item you want to calculate less the cost per success with no item
So, using this information, I can set up some "buy" orders in mission hubs and hopefully snap up some items to use. I'm not optimistic about getting many meta 4 items at a good price - they tend to go for millions compared to a benefit of under a million isk. But the meta 1/2/3 for many items I should be able to get hold of.

As long as I pay less than the "average benefit of item" (using the actual value of my own datacores, not the illustrative 1m isk cost of datacores used in the table above, obviously) then this not only helps my profit margins but also should help me get a more reliable flow of inventions. Win/win!

Wednesday, 14 July 2010

Imperfect storm

It has been a somewhat frustrating week for my corporation. A bad run on inventions combined with a shortfall of a few materials, compounded by a busy personal life and so reduced time in Eve, conspired to reduce my manufacturing to a trickle. The corp wallet ticked over a billion for the first time though, but then I had to spend well over 100m on materials. There are clearly lessons to be learned though and once I've had the opportunity to do a bit more analysis, I'll do a proper post on managing operational efficiency. I've been building a little spreadsheeet to help with forward planning and the numbers that come out of that should be illuminating.

There's also a bit of a backlog of stuff to sell, although that's not too bad, prices seem stable and if anything on a marginal upwards trend. There's a bit of speculation on the forums that this is down to the increasing prices of the tech II manufacturing materials which are built from Planetary Interaction, although personally I think this has a pretty slim impact. My "forward planning" spreadsheet will also show my "materials basket" and I should be able to analyse the real impact of the rise in price PI products, and compare the impact to the downwards trend in mineral prices. At the moment I'm skeptical that there will be much in the way of overall price changes to tech II from PI, but I'll wait and see what the numbers show.

Thursday, 8 July 2010

Selling - location, location, location

As I said in a previous post, I've been selling primarily in a trade hub and a mission hub. The graph below shows the relative number of transactions in each location.
It's (almost) the same "suite" of items that I'm selling at both. I have found though that some items just don't shift at all at the mission hub, whereas other items are actually almost as popular there as at the trade hub. It takes a bit of time to learn exactly what sells where, but hopefully this information might be useful to other people planning their sales strategy. The simplest use of this would be to decide how much of each item to list in each location as a starting point until you can see which items work best at which locations.

Mission hubs verus trade hubs:
  • Items in the mission hub generally take a bit longer to move
  • Prices are typically a 10-20% premium over the trade hub
  • Orders in a mission hub generally require a lot less "babysitting" - there's less people playing the 0.01isk undercutting "game" with you
  • Sometimes you'll see people undercutting the trade hub at a mission hub. This is an opportunity: you can buy them out and relist at a higher price, or wait it out and list your items at a premium once theirs have gone
  • Trade hubs are generally where you find the big lumps of orders (hundreds or thousands of items listed in a single order) but in mission hubs you're competing against smaller sized orders which can (occassionally) move quickly, leaving the hub wide open for you to exploit. In other words, timing becomes important, unlike trade hubs where generally all items are available all the time. There can even be times where you need to adjust your prices up in a mission hub if you become the only supplier
  • Trade hubs generally seem to have one station which is used exclusively
  • In mission hubs, items can sell at more than 1 station - check out what agents are in which stations. Stations with level 4 agents get the most action, but if you're selling frigates or cruisers (or modules for those ships) stations with lower level agents may be fruitful
That's some early thoughts after a month of experimenting, hope it's useful to somebody!

Tuesday, 6 July 2010

May-June Corporation reporting

The first 2 months of my corp have been pretty successful, and I've learnt a lot doing this. I have done tech II production before and I think I made billions over the last couple years, but I never kept track. Certainly I have plenty isk and I can't think where else it came from!

The corp allows me to keep track since its wallet is separate from mine. I've not done this on this scale before - my own POS and a recently "matured" industry alt adding significantly to the size of the operation, so it just seemed appropriate to start a corp.

Below are my key thoughts on my first months and under that are the financial results.
  1. There are 2 "employees", currently my main and an industry alt.
  2. Primary activity is tech II manufacture.
  3. Tax rate is zero, the purpose is to keep track of manufacturing profit/loss only.
  4. At the moment between them I can run 19 research jobs and 14 manufacturing jobs simultaneously. What is holding the corp back more than anything right now is the limit on manufacturing jobs, even using POS arrays which reduce manufacturing time. I can invent more than I have the capacity to manufacture. So my alt is training up some skills and I'm going to buy an implant to reduce manufacturing time. I am also considering increasing the number of manufacturing arrays at the POS as currently 40-50% of manufacturing jobs are completed using station facilities which are slower, although see point 6.
  5. I have no issues selling what I can manufacture, the markets I'm in can easily support greater volume without affecting my sale price. I thought it would be much harder work selling higher volumes with a lot more "babysitting" of orders, actually although there is some extra effort involved, it's less than I had feared. Logistics were also all set in place while the corp was being set up and while that was a hassle at the time, my risk of "burn out" seems low right now. I feel confident that if I want a little break, I can take a few days off easily while just keeping manufacturing ticking over - in fact I had to take some days off anyway for real-life reasons and it had little impact, it was easy to clear inventory once I got back.
  6. The POS is a large expense in terms of fuel and POS structures may decline in price following the introduction of PI, which would have a negative impact on the value of corp assets. In contrast the cost of manufacturing and research fees at local stations is extremely low. At the moment my decision is to keep the POS for 2 key reasons: (1) it provides copy slots which otherwise have a 2-4 week wait time in Empire and (2) the manufacturing arrays give a bonus to manufacturing speed.
  7. I am operating in markets I know, selling mainly in one trade hub (80% of sales volume) and one mission hub (17% of sales volume). The corp is attempting to find new sales locations, and some have been scouted for suitability. Entering any new market is a risk but the key objective is to increase profitability (not volume - as previously indicated there is plenty volume at the trade hub).
  8. Profit per item ranges from 13% to 95%. 17 different items were manufactured this month - diversity is critical in my opinion. Some additional new BPOs were purchased and further new items are being investgated. Likewise, new items can be a risk, but not exploring new items is also a risk.
  9. The worst aspect of this month's results (below) is that only 80m was spent on trading. Most of the items have not yet been sold and some have quadrupled in value - this is good, but I should have trusted my instincts and "gambled" more. Hindsight is a wonderful thing, however, and over 10% of the corp's wallet spent on a risk seemed quite a lot at the time.
  10. Lastly, PI production chains have been set up on both characters to supply POS fuel and some tech II components. The corp will purchase these at market prices. These chains lower time spent on logistics, as all POS fuels and required components can be created in the "home" system. This is actually through luck rather than foresight, but every successful business needs a bit of luck!
And now, some hard financial figures:

Profit/loss: +496.3m isk
Revenue: 989.4m isk
Spend: 493.1m isk
Assets: 709.2m 
Debt: 1417.0m

Note: There are only 20 days of actual sales, the corp was set up in May but setting up took some time, along with an invention/manufacturing lead time, so sales did not commence until June 10. The progress of the corporation wallet can be seen in this earlier post.

I'm not going to give a breakdown of revenues right now as I don't wish to disclose what I am manufacturing, although in future posts I may give some detail. Mostly (not entirely) it's tech II. My spend is detailed below, with some notes. Note that materials spend includes datacores, minerals and construction components - nothing is "free" to the corp, it pays my characters the market value for datacores and so on. This makes the corp's results a true reflection of the profitability of tech II manufacture.

The "debt" is essentially my initial investment from my main character. I have counted the cash plus the value of all items at the time they were donated (mainly the POS and blueprints). Lastly, the "assets" line is rather simplified and is just the sum of CAPEX in the first 2 months, basically just the POS and blueprints (note: "assets" and "debt" are not included in the profit/loss equation). Assets should really include materials in the corp hangar, unsold inventory etc but I'm going to ignore that mainly as it's a pain to calculate.

Total purchases: 468.9m isk
Breakdown:
  • Materials: 320.9m (mostly tech II construction components, also some minerals)
  • Trading: 80.9m (speculation mostly on PI products before they were removed from the market)
  • POS Fuel: 61.8m
  • CAPEX: 5.2m (new BPOs, POS structures etc)
Other spend: 24.2m
Breakdown:
  • Broker's Fees: 1.6m
  • Transaction Tax: 4.4m
  • Manufacturing fees: 0.3m (some manufacturing jobs done in station rather than POS)
  • Offices: 17.8m
  • Research fees: 0.1m (some research jobs done in station rather than POS)
Total debt: 1417.0m
  • 704m CAPEX (BPOs, POS structures etc)
  • 25m POS Fuel
  • 488m Materials
  • 200m Cash

Monday, 5 July 2010

Planetary Interaction markets emerge


I'm going to examine two categories for PI products: POS fuels and components for tech 2 production.

POS fuels: Coolant, Oxygen (P1), Mechanical Parts, Robotics (P3)
Tech 2 production materials: Construction blocks, Consumer Electronics, Guidance Systems (P3), Mechanical Parts, Miniature Electronics, Robotics (P3), Rocket Fuel, Superconductors, and Transmitters.

Both Robotics and Mechanical Parts fall into both categories. Unless otherwise noted, all of the products are P2. There's a slideshow below with comments, and you can click on the graphs to see a larger image.


Broadly, this follows the pattern for new markets from in my previous post (required reading if you're going to make the most of this post, sorry!). This is most evident if you look at the Superconductors, where the player-driven market actually started a bit early in this region, since there were no NPC sell orders. The hoarding and buying/selling between players started when Tyrannis was announced, not when the patch actually happened.

So what can we take from this as a guide to prices?
  • We can probably exect to see the "normal" new market price patterns
  • The trouble is, with many of the materials it's hard to know right now if they are going to continue to rise (i.e. we have not reached the high point of the initial peak yet) or start to decline
  • Volumes traded are VERY much lower than previously
  • Interestingly, you can see from some (it's most noticable on Guidance Systems) that volume traded is almost zero and yet the price pattern remains the same! This I find very interesting - the price pattern is down to buyer/seller psychology and apparently not dependent on any significant trading occuring. Interesting for me anyway, doesn't have that much real impact on the actual market.
  •  I predict volumes will only return slowly and may never reach the levels they were at before. This is partly because of hoarding, and partly because POS owners and tech 2 producers will have set up their own supply chains. I know I have.
  • I think what we'll see is a flattened out version of my "new market" pattern, with a fairly bumpy ride along the way. Like so:
 
    Where it's "bumpy" (especially in the coming few months where I predict prices will stay at the higher end but fluctuate pretty wildly) there is money to be both made and lost through speculation, but I would describe this as a high risk strategy. Your best time for speculation was before the market started - I did that, I only regret that I only sunk a few tens of millions into buying up NPC goods, and not hundreds of millions.

    Since blog posting is limited for space and I have only finite time available to me, I haven't done all the analysis I could (note: I'm a market analyst in real life). There is one particular thing you might think is missing, but it actually would not form part of my analysis anyway. It's production costs. Largely, I do not care about production costs in my analysis. In a free market, it does not matter what you'd like to sell your product for, the market will decide what it's worth. Also, profits based on production costs at a time when every component is rapidly changing price on a daily basis are really quite arbitrary figures.

    That is why I have chosen to specifically look at these products - because they are an end product in themselves with value, not merely a production material for a larger process. Those other PI products which are (in effect) just materials are likely to have their price dictated to by the ultimate price of the new player-built POS structures, and it's far too early to see how that might shake out.

    However, if you do want to look at (what I would call arbitrary) costings, then someone did a good job on the forums. Eve forums post. It's an interesting analysis but since I believe the market wil dictate prices, I can't help but agree with one of the comments by another poster: "Friendly advice from someone involved in RL trading: make your tools follow the market, not the market follow the tools." Couldn't have said it better myself.

      Saturday, 3 July 2010

      New Market, Old Pattern

      One of the things I often look at in my job as a market analyst is the emergence of new markets. With Eve's new expansions every 6 months or so, this means some new markets on a regular basis. The last big expansion brought new items from wormholes, which seeded the market for components required in tech 3 item production, and the most recent expansion brought with it planetary interaction (PI) which also opened up new markets for players.

      Firstly, in real life markets, there is a typical pattern to the cost of goods over time, shown in the graph below.
       New product categories typically sell for a high price initially. This is driven by a number of factors such as:
      • scarcity
      • new product categories are often seen as "premium"
      • cost of manufacture tends to be higher until the market establishes itself and (if the product category is successful) economies of scale start to come into play
      • Early markets are closer to a monopoly, so competition effects do not come into play immediately
      As the market grows in volume, more companies start to make the product and competition ultimately also drives the price down.

      Eve is slightly different since there is almost no scope for economies of scale to come into play, but manufacturing costs tend to be driven down in a similar way - components for production of new items are often introduced at the same time as the new products (for example, sleeper salvage and T3 items) and so manufacturing costs come down as the components required become less scarce and follow a similar pattern to the one shown in the graph.

      The Market for T3

      So how does this compare to the market for T3? Are we seeing the same patterns? Yes we are. The graph below shows how that market has developed during its first year.
      Unfortunately we've missed the very start of the market by a couple of weeks, but I think you can see that the pattern is what would be predicted. You can pick any of the popular subsystems and you'll see the same pattern.

      With unpopular subsystems, since demand is low the market for those items, trends don't work quite the same way but this post is a giant already so I'll deal with that another time.

      Planetary Interaction

      This is a brand new market, less than a month. It's also somewhat different because most of the items were previously available at a set price (set by the designers of the game). Looking at this market I am seeing a number of unusual dynamics going on (although broadly the pattern is starting off in with somewhat similar shape - prices are still rising to an "initial high" for most PI items). I was intending to write about PI in this post but this is quite long already so I will deal with it in the next day or two.

      Friday, 2 July 2010

      June Corporation Update

      As I mentioned in my first post, I have started to run a small industrial corporation. There is only my main and an industrial alt in it. June was the first full month of the corp's existence, and the first month where anything was sold. Below is a graph of my progress, with a couple of notes.

      So far so good! Around half a billion isk in the first month.

      This is just the first snippet of information - but it shows what can be achieved with 2 characters, enough investment to set up a POS, and a bit of forward planning. In future posts I'll reveal some more detailed financial information which should help others with their own industrial corporations. I'll also be posting this and more detailed financial info on a monthly basis.

      Thursday, 1 July 2010

      Time is money?

      One underlying assumption I have to make in order to do various calculations is to put a value on time. So I'm going to try and answer this basic question:

      "How much is time worth in Eve?"

      There are various ways of answering this. I'm going to examine the value in isk (the in-game currency) and dollars, which has the interesting side effect of allowing me to calculate an isk/dollar exchange rate.

      One way is to look at subscription fees, which can be found here. This gives us an upper limit of $14.95 per month, and an upper limit of $131.40 per year. Most industrial processes in Eve (manufacturing, research and so on) are measured in hours, so let's convert to that. Note that for the upper limit I'm using the worst case scenario (28 day calendar month) and for the lower limit the best case scenario (366 day leap year).
      • Upper limit: 2.22 cents per hour
      • Lower limit: 1.50 cents per hour
      Although this is useful, it's actually only useful for some calculations. The Eve server has downtime scheduled for one hour per day, so it is not possible to play 24/7. However, skill training and industrial processes keep going during downtime, so for the purposes of most of the calculations I intend to be doing, those are the right numbers.

      I'd also like to be able to quantify time in terms of isk (the in-game currency). That's a bit more difficult, but since you can also buy game time for isk, we can do that calculation. However, like almost anything in Eve, game time is bought and sold in a free market, so the price fluctuates over time. Also, if you are buying game time using isk to buy PLEX (Pilot's License Extension) you can only buy 1 month at a time. It is possible to buy greater amounts of time using timecodes which can also be bought and sold for isk on the forums, but it's impossible to get good data from the forums whereas it's easier to get an accurate measure from the in-game market, so I'm going to base my calculations on the cost of PLEX.
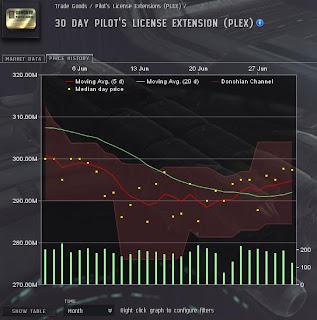
      That's what the market for PLEX looks like. Also, the lowest sell orders are 303m isk and the highest buy order 293m isk. So currently it's around 298m isk for 30 days (PLEX time is counted by days, rather than calendar months which is how subscriptions are priced). This gives us (at today's prices in the Sinq region):
      413,889 isk per hour

      We can see from the market graph that this is on a downwards trend, although there has been a slight uptick in the last few days.

      Bureau de change

      This can also effectively give us a dollar/isk conversion rate, in fact two different rates. Taking an average of the per hour rate calculated from subscriptions of 1.86 cents/hour and comparing that to 413,889 isk/hour we get:

      $1 = 22.25m isk 

      CCP also sells PLEX directly for $34.99, which gives this exhange rate:


      $1 = 8.52m isk 

      So which exchange rate should be used? CCP buys dollars in exchange for what ostensibly becomes isk at the latter exchange rate. For players buying PLEX, this is also the correct rate. For players buying subscriptions, they are on averge getting the better deal at a rate giving them game time worth 22m isk for the price of a dollar. Really I should do the calculation for each type of subsciption but this post is long enough already. Basic point is - subscriptions are better value than PLEX so if you are not struggling for real-life cash, then use real-life cash to pay your sub. You can play for "free" with PLEX but by the (somewhat artificial) measures economists use, it's worse value.

      I am going to use the $/PLEX exchange rate for any real-money translations that I want to do, mainly because if you are a player considering some market activities such as trading and you want some in-game capital to get started, this is the rate at which you would purchase isk. It represents the dollar cost of buying your way into the in-game trade/industry/manufacturing activities. It's also a much simpler measure.

      Incidentally, my own main character's current wallet has 2 billion isk (although there is more tied up in assets and investments) which gives my in-game wallet a dollar value of around $235. That's not a lot of wages for 5 years!

      Note: Buying isk from isk-sellers is against the ELUA (End User License Agreement) and will get your Eve account banned. Also, I don't understand why anyone would buy isk from dodgy websites when you can buy it by purchasing a PLEX as described above. You risk a ban and having your Eve account hacked. Don't do it, kids. Srysly.

      First!

      In Eveonomics, I will be applying some economic principles to the in-game market of Eve Online.
      • I have been playing Eve on and off for 5 years now, and have a small industrial concern which has made my character a multi-billionaire.
      • In real life, I am a market analyst, but not a multi-billionaire. I'd rather be the multi-billionaire 5-year-old in real life, but them's the breaks...